Friday, 31 October 2014

The European Union Continues on Its Course to Lower GHG Emissions

The European Union confirms the next milestone along its energy Roadmap. The nations of the world are working toward establishing a new climate treaty by late 2015 that would lower future greenhouse gas emissions (among other provisions). Independently, the European Union (EU) agreed to a significant goal in reducing emissions of greenhouse gases (GHGs) on October 23, 2014.  The EU is a supranational organization of 28 member nations.  As detailed below, it has had policies in place for almost a decade to reduce GHG emissions.  The new pronouncement extends its timelines and codifies goals it had already established earlier.  Specifically, the EU agreed to lower GHG emissions by 40% below the emission levels of 1990 by 2030.  The goals also include achieving a 27% share of energy from renewable sources, and increasing energy efficiency by 27%.

Emission Trading Scheme. The EU began implementing policies to reduce GHG emissions as the Kyoto Protocol (KP) became effective.  Even before KP entered into force the EU created its Emission Trading Scheme (ETS) in 2005 in preparation for entering under its emissions restrictions.  The ETS is a cap-and-trade regime covering over 11,000 major fixed sources of GHG emissions, both governmental and corporate.  Unfortunately, for much of the time since then the ETS has failed effectively to set a market price for GHG emissions that would succeed to lower emissions.  Initially, too many allowances for emission were issued, so that their price tumbled.  As this was corrected, the Great Recession reduced economic activity, lowering demand for energy, again pressuring the price for allowances to fall.  As recently as 2013 the European Parliament temporarily suspended marketing new allowances.

The deliberations leading to the new declaration also had contentious issues .  Reducing emissions of carbon dioxide (CO2), the most prevalent GHG, affects coal-burning generating plants most severely because use of coal emits almost twice as much CO2as does burning a fuel such as natural gas.  Countries in the EU heavily reliant on coal for electricity, such as Poland and other eastern European countries, were concerned that the excessive burdens of complying with the new constraints would hinder their economic growth.  The United Kingdom objected to goals for installing renewable power because of its new-found energy wealth in natural gas.  Germany has shut down its nuclear power plantsafter the Fukushima disaster, placing a greater burden on its existing coal-fired plants.

The new declaration keeps the EU within its overall timeline for long-term, major reductions in GHG emissions according to its energy Roadmap (see below).  But several environmental scientists and commentators consider the plan to be inadequate to achieve the stringent Roadmap objective in 2050.  They are concerned that the plan would leave too much of the intended reduction in emissions to be achieved later, in the two decades between 2030 and 2050, an achievement that may challenge the best technologies and policies available.  For example, Richard Black, the director of the British Energy and Climate Intelligence Unit, a nonprofit organization, doubted that this plan would “allow the E.U. to meet its long-term target of virtually eliminating carbon emissions.”

Background

The countries of the world currently face highly disparate energy situations and climate environments.  Their different conditions color their outlook as the world faces the problem of global warming brought on by humanity’s use of fossil fuels for energy.  In developed nations, which have benefited from the industrial revolution since its early days, citizens are comfortable with the lifestyle that abundant energy affords them.  Many are reluctant to change their ways to reduce emissions.  

Developing nations, on the other hand, have been applying energy-intensive technologies to expand their economies only in recent decades, desiring to catch up to the developed countries in relatively unconstrained fashion.  Their people too are reluctant to move away from fossil fuels to fulfill their growing energy needs. 

Impoverished countries and island nations experience the harms brought on by global warming for which they have not been responsible.  Their citizens hunger for the benefits that wider energy use could provide; those in island nations face encroaching seas as land-based ice sheets continue melting.

The United Nations Framework Convention on Climate Change (UNFCCC) has scheduled periodic global climate reports by the Intergovernmental Panel on Climate Change since 1990.  The UNFCCC led to negotiation of the Kyoto Protocol (KP) in 1997.  KP required developed countries to reduce greenhouse gas emissions, but excluded developing and impoverished countries from coverage.  KP entered into force in 2005 after the requisite number of countries ratified it (the U. S. never did, so it was not governed by its restrictions).  Most nations acceding to KP agreed to reduce emissions by varying amounts, generally less than 10%, below emission levels of 1990 by 2012. 
 
The  European Union issued a Roadmap for greenhouse gas emission reductions in 2011, intending to reduce annual emission rates by 80-95% below the level of 1990 by 2050 (see the following graphic). 

Source: “A Roadmap for moving to a competitive low carbon economy in 2050”,  broken down by economic sector. European Commission, March 8, 2011;
  
 
Interim milestones were established for reductions in emission rates of 7% by 2005, 20% by 2020, and 40-44% by 2030.  The European Environment Agency determined in 2013 that the EU is on track to achieve the 2020 milestone.  Renewable fuel use had climbed to 14% of total energy consumption.  About two-thirds of this originates from burning biomass and waste; in Sweden and Austria hydropower is also an important renewable source of electricity.  Wind and solar power contribute relatively small amounts to generation except for Denmark and Portugal (wind) and Cyprus and Spain (solar).
 
The EU is the most proactive region among developed countries in establishing policies to lower emission rates of GHGs.  The U. S., in contrast, has no legislated national energy policy directed toward mitigating GHG emissions.  In light of this failing executive actions of the Obama administration have imposed major limits on fossil fuel use in the transportation sector, have limited emissions from new electric power plants, and are proceeding similarly to lower emissions from power plants already in service.
 
Emissions from the developed countries of the worldconsidered as a group have been relatively unchanged in recent years, and are projected to continue that trend (see the graphic below).


Annual rates of energy usage for China, the U. S. and India.  Actual use up to 2010; projected usage thereafter.  1 quadrillion = 1 million billion.  Btu, British thermal unit.
Source: U. S. Energy Information Administration; http://www.eia.gov/pressroom/presentations/sieminski_07252013.pdf(slide 5).

 
Energy use by developing countries will continue growing up to at least 2040, in contrast to the projected behavior of industrialized countries.  In the graphic above, expected energy use by China and India, which exemplify developing countries, expands dramatically in future years.  As noted earlier, energy use for the U. S., an example of a developed country, grows only very modestly to 2040.
 
Conclusion

The declared intention of the European Union to continue meeting its milestones under the energy Roadmap to 2050 is a major contribution to mitigating worldwide GHG emissions.  Similarly the executive actions taken by the U. S. have set it along a similar path, even if not enshrined in law.  These examples show “leadership by example” for the rest of the world as negotiations proceed toward a new worldwide climate treaty intended for completion at the end of 2015.  The continued expansion of fossil fuel use by major developing countries such as China and India, among others, stands in marked contrast to the examples of the EU and the U. S.  If left unaltered, policies of developing countries could potentially impede negotiation of a meaningful treaty.  Yet significant progress toward mitigation of GHG emissions must be made in order to keep the world’s long-term average temperature from increasing more than 2ºC (3.6ºF) higher than the prevailing temperature before industrialization.  This is the upper bound adopted at the Copenhagen (2009) and Cancun (2010) conferences of the UNFCCC.  The nations of the world must succeed in these negotiations.

© 2014 Henry Auer


Denier Logic On Display

Let me start out with a quote from the individual, Shawn Alli, I'm about to discuss: "*Disclosure: I am a climate denier, albeit a more rational one. In Part 3 I explain why I’m a climate denier and not a climate skeptic."

I get all sorts of complaints from people complaining when I use the term 'denier.' I even had someone recently accuse me of calling people mass murders when I use the term. Yet, as we can see, they use the term themselves. For the sake of clarity, I use the term 'denier' to refer to people that deny science. That is all. In my mind, I equate deniers to people that say the Moon landings were faked, there is a face on Mars built by aliens, Hillary Clinton is a reptile person in disguise (I'll admit that one is easier to believe than the others), psychics are real, the Holocaust didn't occur, 9/11 was done by the government, creationism is real and the Sandy Hook school massacre wasn't. But, that is not why I call them deniers. I call them deniers because they deny science. Also, note that I never equated ANYONE to doing any of those crimes. Just because you think the Holocaust did not occur does not mean, in ANY kind of logic, that I am saying they participated in that heinous act. I group these people together because they all suffer from the same failed logic and the inability to escape from the trap they built for themselves. The very comments I receive about using that term typically proves my point - they bring up false arguments about the term, all the while using insulting (sometimes extremely insulting) references (including Shawn Alli) towards climate scientists and people who accept the science of climate change. Basically, if you want people to stop saying you're a denier, stop denying science. It really is that simple.

So, I'll be referring to Shawn Alli as a 'denier' because he/she wants to be referred to as such.

Shawn Alli contacted me through my blog email with the following question:

Hello Dr. Christopher Keating, this is Shawn Alli, a philosopher and blogger from Canada. I’m writing a series of articles questioning the man-made CO2 climate change theory and wanted to know if you could comment on the following question: On your Dialogues on Global Warming blog you state:

“But, I am sure I will never have to because it can't be proven. The scientific evidence for global warming is overwhelming and no one can prove otherwise.”

Do you believe this claim represents and environmental ideological belief?

Thank you very much for taking the time to respond.

Sincerely,

Shawn

This is my response:
This is not an ideological belief. It is a scientific conclusion reached by conducting extensive and exhaustive research on the scientific research and claims made by the contrarian community. As for what others think, I do not speak for others, but I would point out that it has been thoroughly demonstrated that climate scientists are nearly unanimous in the conclusion that manmade emissions are responsible for changing the climate.
Mr. Alli wrote a series of posts about why he is a denier and his views on the subject. You can the read the first one here, with links to the other seven. (I am not sure if Shawn is male or female so I am addressing this person in the generic sense. I apologize for any gender mix-up.) In the very first paragraph of the very first posting he revealed the failure of his logic:
Too many hurricanes this year? Too many lightning strikes? Too hot this year? Too cold this year? Not enough extreme weather this year? Species dying out? Not enough food on the grocery shelves? Electricity bill too high? In the minds of CO2 cult members, the blame goes to man-made CO2 climate change.
To him, it is not science, it is a "cult." Mr. Alli immediately demonstrates that he is not willing to consider anything that goes against his preconceived beliefs. With that statement, he is declaring, "No amount of science or logic is capable of ever changing my mind." He truly is a denier. Unfortunately, he is not the only one. In fact, he is merely typical. Our society is filled with them.

I had an interesting conversation with a gentleman last night that pertains to Mr. Alli and people like him. This guy was about 70 years old and he told me about how when he was young most of his friends smoked, but he didn't. He and his friends had discussions about the hazards of cigarette smoking, but his friends all denied (there's that word again!) the science and insisted on believing what the tobacco companies told them. He told me every single one of them is now dead. They all died from lung and heart disease. He is still going strong.

The moral of the story is, denying the science will not stop nature from doing what it does.

I advised Mr. Alli to go through his postings and remove all subjective statements, leaving only what is factual. There would actually be very little left over. This demonstrates that this is not a work about discovery, about learning. It is a work about justifying his preconceived conclusion. In his mind, there is no discovery, no unknowns, nothing to learn. And, he is willing to go to great lengths in his attempt to prove it.

Now, this is not about beating up on Mr. Alli, it is about beating up on denier logic and he just happens to be an example that came across my desk. Like I said, he is actually pretty typical. Take a look at his response to my email. It is not very original and I have heard these complaints many times, so it is a good example of typical denier non-logic:
In June-July 2014 Dr. Christopher Keating, a physicist, challenges climate skeptics and deniers to prove that man-made climate change isn’t happening and will give anyone who can do it $30,000. [32] Not a bad ploy, but it’s meaningless. Just like James Randi’s million dollar challenge for anyone who can demonstrate psychic phenomena, [33] the rules/conditions will always prevent the party from declaring a winner. Or in other words, the individual’s ideologies will forever prevent them from paying out. And this is true of Keating. In his own words he says:
...I am sure I will never have to because it can't be proven. The scientific evidence for global warming is overwhelming and no one can prove otherwise. [32]

In an email request for comment I ask Keating if believes this claims represents an environmental ideological belief. He says:
"This is not an ideological belief. It is a scientific conclusion reached by conducting extensive and exhaustive research on the scientific research and claims made by the contrarian community. As for what others think, I do not speak for others, but I would point out that it has been thoroughly demonstrated that climate scientists are nearly unanimous in the conclusion that manmade emissions are responsible for changing the climate."
Saying that "no one can prove otherwise," and that "it can’t be proven," [32] is representative of an individual’s ideologies and has no place in objective impartial science. Individuals such as Keating will go to their graves believing that their ideologies are representative of objective impartial science and that humanity is doomed because of carbon emissions. In the end, it’s nothing more than fear mongering junk ideological science.

So, class, how many flaws in logic and facts can you spot?

First sentence, "June-July 2014". No. Sorry, Mr. Alli, you demonstrated your lack of homework. I mean, not even the basic type of homework. The challenge started out over seven years ago. That was on a different blog, which I ended, but I have told the story on my blog many times. On this blog, the challenge started as the $1000 Global Warming Skeptic Challenge on May 12, 2012. Poor job there, Mr. Alli.

Continuing, he states, [Keating] "challenges climate skeptics and deniers to prove that man-made climate change isn’t happening." I'll let this one slide a little, but it still demonstrates his lack of effort to do any homework. His statement is not factually correct, but I did call it a "challenge." In fact, if Mr. Alli had done any homework, he would have found out that the challenge was for deniers to put up or shut up. I even used those words several times. The challenge was a way to allow people who claim they can prove AGW is not real to do so. I did not ask anyone to do anything they were not already claiming they could do.

Next: "Not a bad ploy, but it’s meaningless." Mr Alli fails utterly on this one. It most certainly wasn't meaningless. It was a sincere challenge and I would have paid off if anyone had succeeded. The point I was after, and I believe the deniers proved, is that there is no science to support their claims. They complain that they are being shut out of the debate. I gave them their opportunity. That is, most assuredly, not meaningless.

Moving on, " the rules/conditions will always prevent the party from declaring a winner. Or in other words, the individual’s ideologies will forever prevent them from paying out." Once again, total failure of logic and facts. The rules were adapted from a denier challenge (I always find it interesting how deniers deny (!!!) that fact when complaining about my challenge). I actually made them more advantageous to the deniers because, unlike the original denier challenge, I did not charge a submission fee and I provided a detailed response to all original submissions (I received many versions of some submissions and only responded to the first). Again, if anyone had succeeded, I would have paid. The problem is that the denier community, including Mr. Alli, things it is smarter than all of the world's climate scientists combined and that they can produce some simple proof that no one else has ever considered and will cause all of climate science to crash down in ruins. There is a word for that - hubris.

He then states, "In his own words he says:
...I am sure I will never have to because it can't be proven. The scientific evidence for global warming is overwhelming and no one can prove otherwise."

In some dim part of their brain, deniers think this statement proves that my challenge was a fraud and this somehow proves climate change is not real. To show just how false this statement is, and just how false their logic is, let's put it in another context. Suppose the challenge read this way:

I am sure I will never have to [pay] because it can't be proven gravity is not real.

Or, this one:

I am sure I will never have to [pay] because it can't be proven humans don't need oxygen to survive is not real.

Or, this:

I am sure I will never have to [pay] because it can't be proven the Earth orbits the Sun is not real.

Or, any other of an infinite number of scientific facts.

The reason I said I was sure I would not have to pay is because I know the science is conclusive (Yes, Virginia, the science is settled.). Does anyone really think I would have put up $10,000 of my own money if I believed I would have to pay? No, I knew the science was irrefutable before I went into the deep end of the pool. Mr. Alli's statement completely ignores all of that logic and all of the facts. Yet another massive failure on his part.

Let's just cut to the chase and lump the rest of this effort into one last example. "Saying that "no one can prove otherwise," and that "it can’t be proven," is representative of an individual’s ideologies and has no place in objective impartial science. Individuals such as Keating will go to their graves believing that their ideologies are representative of objective impartial science and that humanity is doomed because of carbon emissions. In the end, it’s nothing more than fear mongering junk ideological science."

No, Mr. Alli, stating facts is not an ideology. Total logic failure there. What if I stated, "The Sun is shining and no one can prove otherwise", would that be an ideological statement? In science, it is not an ideology to stick to the facts. But, apparently, it is a ideological issue with deniers.

As for me going to my grave believing in science and the scientific method? Yes, I will do that. That is, in fact, how you do objective and impartial science. Something Mr. Alli, and other deniers, seem to be incapable of doing. Or, even understanding. If not, they would realize their conclusions are not valid. The science is that conclusive.

That is at least seven failures in logic and facts that I count in just one paragraph. And, he has eight long webpages of similar effort.

By the way, Mr. Alli, you lied in your disclosure. You said you were a rational denier. There is nothing about your web postings that is rationale. You should remove that part of your disclosure.

In summary, Mr Alli's postings are a total failure in logic and facts and is a typical example of the denier community. Mr. Alli's postings are nothing more than a rehash of what I have already heard, literally, thousands of times before (and so has anyone else that bothers to listen to them). But, no matter how many times they say it, they are still wrong. Their logic is a failure. Their facts are wrong. They are denying the science.

There is no arguing with someone that denies reality in favor of their preconceived conclusion. We can only hope to appeal to those that have not gone off the cliff.


Monday, 27 October 2014

Bush Administration Suppression of Climate Science

One of the revisionist statements I frequently hear from deniers is that contrary scientists are persecuted by the government and that all you have to do to get funding is to say you are researching climate change. Apparently, in their interpretation of science funding, the government is in a grand conspiracy with climate scientists and will throw unlimited amounts of money at anyone willing to publish anything supporting the company line. When I point out that much of the science they object to was actually done during the Bush administration and that administration actively worked to suppress climate change research I typically receive a very strong denial of that. The Bush Administration, I am told, was a very strong supporter of climate change research and never did anything against climate scientists.

I'm not making this up. I wish I was, but this is an example of just how the denier industry is manipulating public opinion. If they say it, there are people that will believe it and repeat it. Of course, the record speaks for itself and clearly shows that administration did, in fact, actively suppress climate scientists.

Now, sadly, Rick Piltz, the man that blew the whistle on this campaign, recently passed away. He not only exposed how the White House was actively working to suppress any science, including climate science, that disagreed with the party line, but he also founded the website Climate Science Watch.

The story was reported by The New York Times on June 8, 2005. Evidence that was leaked included White House documents that actually had hand-written edits by White House officials. He also revealed the main person behind the effort was Philip Cooney. Cooney came to the administration by way of the American Petroleum Institute, which is a fossil fuel funded group, and was hired to coordinate the government's reports on climate change. Cooney left the White House two days after being exposed and went to work for ExxonMobil.

One of the amazing things is how Piltz predicted specific things that would impact the public and saw all of those predictions come true, including the flooding of the New York subways due to a storm surge. Yet, the fact that these things were accurately predicted in advance isn't something you read about. It is all just conveniently ignored.

So, the question remains, if climate science is a grand conspiracy of the government and climate scientists, why is it that much of the key research used to reach conclusions today was done when the White House actively worked to suppress any conclusions supporting climate change? And, don't try to say that the Bush administration did not try to suppress climate science. Rick Piltz showed just how wrong that statement is.


What Impending Climate Change Looks Like

Did you ever wonder what the impending climate change looks like?

Thursday, 23 October 2014

A Summary of Articles on the Effects of Climate Change

Here is a quick summary of a number of articles I have seen recently. I thought I would share them with you.

Global warming leads to oxygen depletion in oceans
Researchers studying the fossil record from a warming event that occurred 55 million years ago have found the ocean oxygen level dropped during the event.

West Antarctic Ice Sheet glaciers lost over 200 billion tons of ice in three years
Using a series of satellites that measure gravity, ice height and ice reflectivity, researchers have been able to measure the rate of change of glaciers in the West Antarctic Ice Sheet. As stated in the link above, the amount of loss is alarming. Here's another article about the research.

Energy executives call for looser government regulations
They have been actively working to prevent any mitigation on climate change and now they are complaining because a minor step was taken.

Tornado activity has changed
Days with multiple tornadoes has increased since the 1970s.

Fish are not adapting
Oxygen levels are dropping and CO2 levels are rising. The fish are not adapting fast enough.

Oil companies are dumping ALEC
The American Legislative Exchange Council (ALEC) is a lobbying group with membership that includes some of the world's largest corporations. This group sits with politicians from across the country and draft legislation and set policies for them to follow. They have been major players in the effort to deny climate change and prevent mitigation measures from being enacted. Now, some big names have been dumping them.  In an appearance on NPR's Diane Rehm's show, Google chairman Eric Schmidt said the company’s decision to fund ALEC was a “mistake,” because the group spreads lies about global warming and “mak[es] the world a much worse place. Everyone understands climate change is occurring and the people who oppose it are really hurting our children and our grandchildren and making the world a much worse place,” Schmidt said at the time. “And so we should not be aligned with such people — they’re just, they’re just literally lying.”

So, there is some good news.

How about the dirtiest power plants in the country?

More record setting heat waves coming to China
Eastern China had a record setting summer with heat waves and droughts.  More than half of its summers will be like this by 2024. That's only ten years. Maybe they need to do something about all of that coal burning they do.

Cost of cyclones goes up
Tropical cyclones are projected to cost the world economy $9.7 trillion over the next century. Projections call for fewer tropical cyclones, but more intense ones. Combine it with increasing coastal populations and rising sea levels and the outcome isn't a good one. Not all that surprising, the countries that lose the most are Japan, China, South Korea and the U.S.

And, if you escape the cyclones you're still in trouble
Rising sea levels will lead to more routine coastal flooding.

Still trouble even if you live inland
Climate change will result in a host of health problems including anxiety and PTSD, heat stroke, respiratory illnesses, infectious diseases, starvation and dehydration.Remember those climate change deniers that keep saying climate change would be good for us?

10 charts that show the danger of climate change
Yikes!

How about that 97% figure?
Deniers are busy claiming the studies showing 97% of all climate scientists support AGW has been debunked. Here's a chart that debunks them, instead. Yes, the deniers are lying again.

Warming causing wild weather
Remember how they keep saying global warming is good for us? Think again.

Sorry for the summary list. I have been very involved with some projects and its hard to find the time necessary to write up everything in depth. Anyway, I hope you find some of these articles interesting or useful.


Wednesday, 22 October 2014

Last 12 Months Hottest Ever Recorded

Included in the news that September was the hottest September ever recorded was the news that the 12 months from October 2013 through September 2014 was the hottest 12 month period ever recorded.  But, there was something else that I find very disturbing in the data. It is also being reported that the first nine months of 2014 was the hottest nine months ever and broke the record set in 1998. Why is this significant? Because, that 1998 record was set due to an El Nino occurring in the beginning of 1998. There was no such El Nino to start off this year. That means, the routine temperature of 2014 is now greater than the pumped-up temperature of 1998. At the time, 1998 was a tremendous flyer, meaning it was way out of whack with all of the other data. Now, temperatures that were once way of line have become routine.

Would someone please assure me again that warming has stopped?

And, by the way, it won't be NOAA. In a CBS News report, NOAA climate scientists Jessica Blunden is quoted as saying that NOAA records show no pause in warming.

What was that? Did I hear that correctly? NOAA says there is no pause in the warming? Yes, in fact, I did hear it correctly. Think about these little tidbits - there has not been a monthly record for coldest month since before 1916 and every monthly record for hottest month has been set since 1997 - including four so far this year.

And, to make you feel even better, it is very likely an El Nino will begin next month and continue into 2015. That will mean 2015 will be pumped-up at the start and will likely be even hotter than 2014. Fortunately, the forecast is for the El Nino to be weak, so maybe it won't set us on fire.

But, if it did, I'm sure the deniers would just say the science is unsettled.


Monday, 20 October 2014

False Logic About Not Dealing With Climate Change

The members of Congress that have been bought and paid for by the fossil fuel industry love to make statements that are just unbelievably stupid. My favorite is when they say, "I'm not a scientist, but..." You really have to wonder what kind of mentality makes you stand in front of cameras and say that you're not a scientist, but you still know more about climate change than all of the climate scientists in the world combined.

The next best thing is when they say we shouldn't act because it is 'unsettled' what the outcome of climate change will be. Just how silly is that? The world is heating up and it is not working out well for us. So, is it going to cost us plenty, or is it going to cost us plenty-plus? That's what isn't certain. But, it is certain bad things will happen to us because bad things are already happening to us.

Here is an excellent article addressing the question of holding off due to "uncertainty." I particularly love the analogy of letting your children kick lions.Yeah, its uncertain what would happen, but are you going to let them do it?

The politicians really are showing they aren't scientists on this one. If they were, they would know that the science really is settled and the only uncertainty is whether climate change will be bad for us or if it will be really bad for us. Either way, we need to act.

State of the Climate for September Continues Trend

The National Climatic Data Center (NCDC) released its State of the Climate report for September and it was as expected - hot. NASA had already reported it found September to be the hottest September ever recorded, the NCDC confirmed it. Disturbingly, it found the average sea surface temperature for September was the hottest ever recorded for any month. In other words, the sea surface has never been measured hotter than it was last month - ever!


Let's update the tally for the year:

September was the hottest September ever recorded;

August was the hottest August ever recorded;

July was the fourth hottest July ever recorded;

June 2014 was the hottest June ever recorded;

May was the hottest May ever recorded;

April tied 2010 as the hottest April ever recorded;

March was the fourth hottest March ever recorded;

We got a break in February. It was only the 21st hottest February ever recorded;

But, that break followed the hottest January since 2007 and the fourth hottest January on record.

So, let's see what the score is so far for 2014: one 21st hottest month, three 4th hottest months, and five hottest months ever.

The January through September period was tied with 1998 and 2010 as the hottest such period ever. If 2014 continues the way it has, it will be the hottest year ever recorded.

But, the deniers will continue to claim the warming has stopped. Then, they get upset when anyone calls them a denier. They are called deniers because they are denying the facts.


Here are some of the highlights from the global and national reports:

Global
  • The combined average temperature over global land and ocean surfaces for September 2014 was the highest on record for September, at 0.72°C (1.30°F) above the 20th century average of 15.0°C (59.0°F).
  • The global land surface temperature was 0.89°C (1.60°F) above the 20th century average of 12.0°C (53.6°F), tying with 2013 as the sixth warmest September on record. For the ocean, the September global sea surface temperature was 0.66°C (1.19°F) above the 20th century average of 16.2°C (61.1°F), the highest on record for September and also the highest on record for any month.
  • The combined global land and ocean average surface temperature for the January–September period (year-to-date) was 0.68°C (1.22°F) above the 20th century average of 14.1°C (57.5°F), tying with 1998 and 2010 as the warmest such period on record. 
  • September temperatures were above average across Australia, with daily high temperatures responsible for much of the warmth. The September average maximum temperature for the country was 2.03°C (3.7°F) higher than the 1961–1990 average, the fifth highest maximum temperature for the month since national records began in 1910. The state of Western Australia was record warm, at 2.75°C (4.95°F) above average, breaking the previous record set in 1980 by 0.44°C (0.79°F). Tasmania reported its second highest September maximum temperature on record and Victoria reported its seventh highest.
  • With high pressure dominating the region for most of the month, the United Kingdom had its fourth warmest September since national records began in 1910, with a temperature 1.2°C (2.2°F) higher than the 1981–2010 average.
  • France observed one of its warmest Septembers since national records began in 1900, with a monthly temperature 1.6°C (2.9°F) above the 1981–2010 average. In the southwest, Brittany and Normandy reported monthly temperatures 2–4°C (4–7°F) higher than average.
  • Denmark had its seventh warmest September since records began in 1874, with a temperature 1.9°C (3.4°F) higher than the 1961–1990 average and 0.8°C (1.4°F) higher than the most recent 2001–2010 decadal average . The average daily maximum temperature was the fifth highest on record for September while the average daily minimum temperature tied with 1998 as third highest (maximum and minimum temperature records date to 1953).
  • Germany had a September temperature 1.4°C (2.5°F) higher than the 1981–2010 average. The warmth was widespread across the country, with every state reporting a higher-than-average September temperature.
  • Austria was 0.7°C (1.4°F) higher than its 1981–2010 average. Switzerland had a September temperature 1.0°C (1.8°F) higher than its 1981–2010 average.
"The first nine months of 2014 (January–September) tied with 1998 as the warmest such period on record, with a combined global land and ocean average surface temperature 0.68°C (1.22°F) above the 20th century average of 14.1°C (57.5°F). If 2014 maintains this temperature departure from average for the remainder of the year, it will be the warmest calendar year on record. The past 12 months—October 2013–September 2014—was the warmest 12-month period among all months since records began in 1880, at 0.69°C (1.24°F) above the 20th century average. This breaks the previous record of +0.68°C (+1.22°F) set for the periods September 1998–August 1998, August 2009–July 2010; and September 2013–August 2014."

National
  • The September national temperature was 66.2°F, 1.3°F above average. This ranked as the 26th warmest September in the 120-year period of record. The average maximum (daytime) September temperature for the contiguous U.S. was 78.3°F, 0.5°F above the 20th century average, ranking near the median value in the 120-year period of record. The average minimum (nighttime) September temperature was 54.1°F, 2.2°F above the 20th century average, the eighth warmest on record.
  • September 2014 Statewide Temperature Ranks Map

    September 2014 Statewide Temperature ranks
  • Locations from the Rockies westward were warmer than average during September. California, Nevada, and Utah each had one of the 10 warmest Septembers on record. Much of the East Coast was also warmer than average. Near- to below-average temperatures were observed across much of the Plains and the Midwest. Crops continued to mature at a slower than average rate throughout the Northern Plains and Corn Belt. Early freeze conditions across parts of the Northern Plains ended the growing season earlier than average.
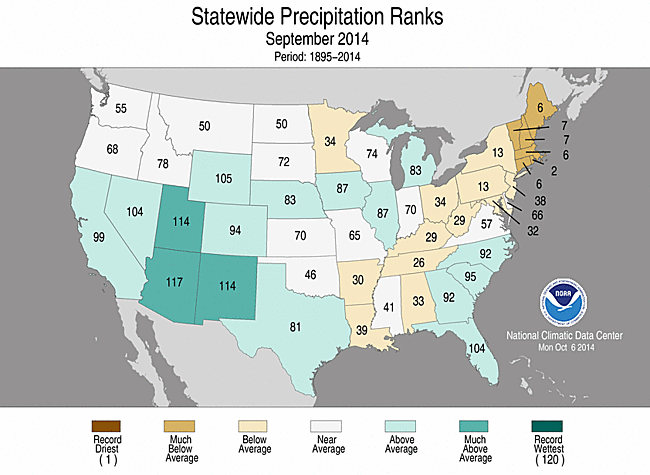
  • The September precipitation total for the contiguous U.S. was 2.58 inches, 0.09 inch above average — ranking near the median value in the 120-year period of record.
  • September 2014 Statewide Precipitation Ranks Map
    September 2014 Statewide Precipitation ranks
  • The near-average September precipitation total for the contiguous U.S. masked regional extremes. The Southwest was much wetter than average, where enhanced monsoonal flow and the remnants of Hurricanes Norbert and Odile brought an abundance of moisture to the region. Arizona, New Mexico, and Utah each had a top 10 wet September. Parts of the Northern Plains were also wetter than average, where heavy rain caused flooding and record monthly precipitation at a few locations in western South Dakota and Nebraska.
  • Much of the Mid-Atlantic and Northeast were drier than average, where Connecticut, Maine, Massachusetts, New Hampshire, Rhode Island, and Vermont each had one of the 10 driest Septembers on record.
  • On September 7th and 8th, a plume of moisture associated with the remnants of Hurricane Norbert brought heavy rain to the Desert Southwest. Locations around Phoenix, Arizona received over six inches of precipitation. The Phoenix Sky Harbor airport received 3.30 inches of rain in a seven-hour period on the 8th breaking the record for the rainiest calendar day in Phoenix since records began in 1895. The deluge caused massive flash flooding and the high water forced the closure U.S. Highway 60 and Interstate 10 in Phoenix.
  • On September 10th and 11th, an early season snow storm and blast of cold air brought snow to parts of the Northern Rockies and Plains. Several locations in the Black Hills of South Dakota set new records for earliest date of snowfall greater than 1.0 inch including Mount Rushmore which received 8.1 inches of snow and Rapid City which received 1.6 inches.
  • According to the September 30th U.S. Drought Monitor report, 30.6 percent of the contiguous U.S. was in drought, down from 32.8 percent at the beginning of the month. Drought conditions improved across the Southwest, Great Basin, Central Plains, and southern Georgia, while conditions worsened in parts of the Southern Plains, Southeast, and the Northeast. Abnormally dry conditions developed in the Mid-Atlantic region. Drought continued to impact California and Nevada, with nearly 100 percent of both states in moderate-to-exceptional drought.
  • Alaska was warmer and slightly wetter than average during September. The state had its 11th warmest September in its 1918-2014 record, with a temperature 2.5°F above the 1971-2000 average. Locations in western Alaska were notably warm; Cold Bay had its warmest September on record. Alaska's September precipitation total was 9.0 percent above the 1971-2000 average.
  • The end of September was notably warm for Hawaii, with several daily and monthly temperature records broken. On September 26th, the temperature at Hilo reached 93°F, besting the previous warmest September temperature record for the city set on September 21, 1951. This was also 1°F shy of the all-time warmest temperature on record at Hilo, which occurred in November 2013.
  • On the daily scale during September, there were 4,285 record warm daily high (1,091) and low (3,194) temperature records and 2,869 record cold daily high (2,122) and low (747) temperature records.

Sunday, 19 October 2014

Oceans Are Even Hotter Than We Thought

We know the oceans are heating at an alarming rate. Take a look at this plot of ocean temperature anomalies for today:
Source: Climate Reanalyzer
This not only shows the sea surface temperature anomaly graphically (Wow! That's a lot of red!), but the numbers at the bottom show the anomalies for different regions of the planet. These numbers represent the anomaly for the listed region between today's measured temperature and the long-term average.

As we can see, there is a lot of excess heat being stored in the upper-layer of the ocean. But, a new report indicates it is actually worse than we thought. A paper published in Nature Climate Change says researchers, using data from Argo floating ocean buoys, have found the temperature rise is actually higher than what has been thought - and by a significant amount. The error is attributed to poor data collection in the southern hemisphere. Now, Argo data indicates the sea surface temperature has been rising between 24% and 55% faster since 1970 than previously thought.

That is highly significant.

If you are not familiar with the Argo buoy network, it consists of thousands of free-floating buoys throughout the world. The buoys are designed to float at depth and take direct measurements of the ocean depths down to 2000 meters (surface temperatures can be recorded daily by satellite sensors). After about 10 days, the buoy will inflate a bladder that will make it float to the surface where it will make satellite contact and transmit its data. The buoy will then deflate the bladder and sink again. The battery operated buoys last about four years. The network has been in operation since 2000 and now has about 3500 buoys floating all over the world. This is an obvious upgrade to the old method of collecting data by lowering instruments over the side of research ships. The amount and currency of data is vastly improved and that data is made available to the public via the program website.

One of the consequences of this is the realization of what it means for us here on the land. Eventually, a much warmer ocean will mean a much warmer atmosphere, along with all of the consequences of that warming such as higher utility bills, more expensive food, increased insurance rates and more severe weather.

I'm sorry, I think I just heard another politician say he isn't a scientists but we shouldn't do anything about climate change. I might have been mistaken. It is possible it was the sound of another billionaire counting the money he is making because we still aren't addressing climate change. Its hard to tell because they sound the same.


Friday, 17 October 2014

Deniers Mistakenly Say that Global Warming Has Ended


Global Average Temperatures and CO2.  The global average temperature has increased by about 0.7-0.8ºC (1.3-1.4ºF) over pre-industrial values.  Humanity’s use of fossil fuels to power industrialization emits carbon dioxide (CO2), a greenhouse gas, leading to warmer average temperatures.  Analysis of the increased CO2 levels shows that they arise directly from burning fossil fuels, and not from natural causes (see also the U. S. National Climate Assessment).

Climate deniers do not accept that our planet is warming, and/or that human activity is its cause.  Climate skeptics may question that human actions are responsible for warming, or that warming is harmful to human populations and other life forms.  Here both groups will be called “deniers”.

Climate deniers claim that global warming has ended.  They selectively display global temperature data for, say, the period 1980 to the present, as shown in this graphic:
 
 
Yearly values of the global average temperature selected for the interval 1980-2013, shown as their difference from the average temperature for the entire 20th century.
Source: Data table from National Aeronautics and Space Administration;
 
 
Other more biased presenters don’t show any data before 1997.  These deniers point to the interval after 1997 as showing that the temperature has remained essentially unchanged (here called the “pause”), breaking with the upward trend from 1980 to 1997.  Since atmospheric CO2concentrations continued to increase during the pause period (see below), deniers state that increasing atmospheric concentrations of CO2 cannot be the cause for global warming.

 
Deniers  cannot selectively choose the data they wish to use while rejecting the entire data set from consideration.  It is unacceptable to focus arbitrarily on only the period supporting their view while ignoring the extended global temperature record.  Data covering most of the industrial era, 1880-present, are shown below. 
 

Yearly values of the global average temperature for 1880-2013, shown as the differences from the average temperature for the entire 20th century.  Black points and line, annual average temperature differences; Red line, smoothing obtained as a 5-year running window centered at each data point; Green, error bars showing estimates of uncertainty in the measurements.
Source: National Aeronautics and Space Administration.  http://data.giss.nasa.gov/gistemp/graphs_v3/
 
 
The overall trend shows a clear, if uneven, rise in the global average temperature beginning at about 1910, coinciding with increasing atmospheric levels of CO2(see below and this post).  Importantly, a seemingly long pause also occurred from about 1950-1975, followed by more than 20 years in which the temperature rose sharply.  It is noteworthy that deniers fail to mention this earlier pause as evidence that warming has ceased.
 
A Simple Inert Earth Model.  Deniers are incorrectly assuming that in the Earth system, the only factor affecting the air temperature around the globe is the amount of CO2 in the atmosphere.  Such a simple model, featuring an inert Earth, may be illustrated using the following graphic.  

Model for a simplified inert Earth system close to radiation balance.  It re-emits much of the sun’s energy back into space as heat (infrared) radiation.  In this model only the atmosphere retains excess heat.  © Henry Auer

 
In essence, deniers ignore any additional components in the Earth system that affect the energy balance.

A Complex Earth System Model.  Why is the Earth’s temperature record so erratic?  Why do these pauses occur?  The answer to these questions is that the Earth is not a simple object inert to the effects of the sun’s energy.  Rather, the Earth is a complex system that responds to inputs of excess energy from the sun in many ways.  This can be modeled by a complex Earth system in the image below.
Model of the Earth system, including CO2 in its atmosphere and potential reservoirs of heat in the land, the oceans and the polar ice caps.  This Earth is not in energy equilibrium; less energy is radiated back into space than the energy falling on it from sunlight.  The extra energy heats the entire earth system, with most of the heat being stored in the ocean rather than in the atmosphere. © Henry Auer

 
This more realistic model for Earth is not in energy balance.  Direct satellite measurements of radiation leaving Earth are compared with sunlight energy reaching the Earth.  Because of the greenhouse effect the Earth retains excess heat, rather than re-emitting it back into space.  

Most of the retained heat is stored in the oceans, and not in the atmosphere.  This is why deniers are mistaken by speaking in terms of an inert Earth model, i.e., in assuming that the temperature in the atmosphere is determined only by the atmospheric CO2 concentration.  This is shown in the following graphic.
 

Top panel: Total heat energy stored in the top half-mile of Earth’s oceans compared to the average from 1955-2006.  Middle panel: Yearly global average temperature compared to the average value for the full 20thcentury (repeating the pattern shown in the earlier graphic).  Bottom panel: Direct measurement of atmospheric CO2 from 1958 in parts per million (ppm).
Source: National Oceanic and Atmospheric Administration;
 
 
It is seen from the lower panel that the CO2 concentration has been rising steadily since 1958; indeed a smooth curve such as seen here extends back to pre-industrial times, when the concentration was 280 ppm.  The pronounced variability in the temperature data (middle panel) contrasts with the smooth, steady increasing trend seen  for CO2.  This suggests, as indicated above, that factors other than only the atmospheric CO2 concentration are at play. 
 
90% of the excess heat retained in the Earth system is stored in the oceans.  The data in the top panel show that heat energy absorbed by the oceans has been steadily increasing since at least about 1970, including the prior pause of global atmospheric temperature, and has continued to increase even during the current pause.  Instead of ending up warming the atmosphere, excess heat has been absorbed into the oceans, warming them (see the Details section at the end of this post).  Since oceans have decade-long cycles of vertical as well as lateral currents, this heat remains latent in the oceans, but will eventually be transferred back to the atmosphere, renewing the trend of increasing global atmospheric temperature.  
 
Conclusion
 
The long-term global average temperature has increased by about 0.7-0.8ºC over pre-industrial temperatures.  A current pause of annual global temperatures began after 1997 even though the atmospheric concentration of CO2 continued to increase during this period.  Global warming deniers have seized on this pause to say that warming of the Earth has ended, since the air temperature has not responded to the increased CO2 concentration on a year-by-year basis. 
 
In fact direct measurements of the Earth’s energy balance show that it does retain excess heat, but does not store it in the atmosphere.  Rather, the excess heat enters the oceans.  It is stored there as deep as 1,500 m (4,920 ft) in slow-moving ocean currents, both lateral and vertical.  As the warmer water is lifted to the surface again, it will exchange this stored heat with the atmosphere, resuming the warming of the air.  Similar processes happened in an earlier pause event.  Global (atmospheric) warming continues on the extended time scales dictated by Earth system processes.  Global warming deniers are mistaken in saying that global warming has ended.
 
Details
 
Guemas and coworkers (Nature Climate Change vol. 3, pp. 649–653 (2013); doi:10.1038/nclimate1863)  examined the current pause in global warming.  They used earlier data as a baseline to project sea surface temperatures forward up to 2010 using a coupled ocean-atmosphere climate model.  From their results they “attribute the onset of [the pause] to an increase in ocean heat uptake.”  They verify that no reduction in the sun’s radiation can explain the pause.
 
Loeb and coworkers (Nature Geoscience, vol. 5, pp. 110–113 (2012); doi:10.1038/ngeo1375) compared the energy imbalance of the Earth system with ocean heat content.  They measured radiated heat energy and sea temperatures.  They found that the energy imbalance of the Earth system and the increase in the upper-ocean heat content are similar in magnitude.  Combining satellite temperature measurements and ocean heat measurements to 1,800 m (5,900 ft) they found “between January 2001 and December 2010, Earth has been steadily accumulating energy at a [significant rate]. We conclude that energy storage is continuing to increase in the sub-surface ocean.”
 
Chen and Tung (Science Vol. 345, pp. 897-903 (2014)  DOI: 10.1126/science.1254937) analyzed earlier data as well as more extensive newer observations gathered by buoys disposed worldwide at various ocean depths.  They found that “the [pause] is mainly caused by heat transported to deeper layers in the Atlantic and the Southern oceans….Cooling periods associated with the latter deeper heat-sequestration mechanism historically lasted 20 to 35 years.”  They further conclude “because the planetary heat [reservoirs] in the Atlantic and the Southern Oceans remain intact, the [pause] should continue on a decadal time scale. When the internal variability that is responsible for the current [pause] switches sign, as it inevitably will, another episode of accelerated global warming should ensue.”
 
© 2014 Henry Auer


The Reason Fossil Fuel Companies Deny Global Warming

If you realize that manmade global warming is real, the next logical conclusion is to do something about it. So, if you can keep the debate focused on the reality of AGW, then you don't have to worry about doing something about it. Now, you might ask, why would someone be interested in preventing us from acting on AGW? Take a look at this article here.

This article discusses the actions taken in Nordic countries to deal with carbon emissions, something they have been very successful at. In fact, they have been so successful they are actually lowering the cost of energy. The alternative sources of power they are now using are actually cheaper than the coal fired power plants they are replacing.

And, that is what the fossil fuel industry really fears.

For instance:
Fossil power plants in Finland and Denmark act as swing-producers, helping to meet demand when hydropower production in Norway and Sweden falls due to dry weather.

The arrival of wind power on a large scale has made this role less relevant and has pushed electricity prices down, eroding profitability of fossil power stations.
And, I love this statement,
"Demand for coal condensing power in the Nordic power market has decreased as a result of the economic recession and the drop in the wholesale price for electricity," state-controlled Finnish utility Fortum said
 Or, this statement,
"This will, in our view, result in mothballing of 2,000 MW of coal condensing capacity in Denmark and Finland towards 2030,"

The evidence is clear - the fossil fuel industry is lying to us when they say renewable energy sources will increase our utility bills and lower the standard of living. What we really see is the exact opposite, the standard of living is going down due to global warming and renewable energy will improve the situation. Today, we are already paying for higher utility bills, more expensive food, higher insurance costs, loss of jobs, and economic damage due to weather extremes. Who is telling you not to worry about all of that? The same people that are making billions of dollars off of it - the same people that stand to lose billions of dollars if we do something about it.

But, we won't do anything about it as long was we argue about the reality of it.

And, that is why the fossil fuel industry fears letting people realize AGW is real.

Thursday, 16 October 2014

Heat Continuing Through September

NASA released it's report for September global temperatures and it wasn't good - September 2014 was the hottest September ever recorded. In fact, according to NASA, 2014 is on track to be the hottest year ever recorded. The National Climatic Data Center (NCDC) will release it's State of the Climate reports for the nation and the globe later this week and we'll see what it has to say. In the meantime, find someone that says there hasn't been any warming since 1998 and show them this graphic:

Thursday, 9 October 2014

Another Denier Lie Exposed

One of the new statements making the rounds among deniers is that no one is saying man made global warming doesn't exist. In fact, I get statements saying that no one has ever said that. I am not kidding. Then, they get upset when I call them deniers.

Well, let's put the record straight. Here is one denier that says it straight up. Unfortunately, he is also in Congress. Please note how the fossil fuel industry is his biggest contributor. Do you think there is a link?

Where are all of the people making that claim now? Any comments from the contrarians, deniers or denier industry?

Tuesday, 7 October 2014

Seasonal CO2 Minimum May Have Passed

In addition to a steady, long-term climb, the level of CO2 in the atmosphere varies by season - dropping in summer and climbing in winter. It looks like we have passed the seasonal minimum and the level is climbing again. The Keeling Curve, the plot of measurements taken at Mauna Loa, Hawaii, normally turns upwards around the beginning of October and is now doing so. The latest daily measurement was 395.58 ppm on October 5. Here is a plot of the measurements for the last two years:

https://scripps.ucsd.edu/programs/keelingcurve/wp-content/plugins/sio-bluemoon/graphs/mlo_two_years.png
Source: SIO


You can see how the curve has turned upwards as well as the year-to-year increase. What is disturbing about this plot is how much it is climbing. Last year, it made news when the level topped 400 ppm. This year, that level was passed for three months in a row. This coming year will see it passed for at least five months. I believe it will be only another three years before we reach the point when the minimum will not drop below 400 ppm. By the end of 2017, we will never again see the level drop below 400 ppm.

Here is the plot of the long-term data:

https://scripps.ucsd.edu/programs/keelingcurve/wp-content/plugins/sio-bluemoon/graphs/mlo_full_record.png
Source: SIO


The 395 ppm level was first touched just three years ago. That means prior to 2011 the CO2 level had not reached 395 ppm at anytime in at least the last 800,000 years. Now, it doesn't drop below that level.

In mean time, contrarians and the denial industry will tell you we don't need to do anything.